By Tom Allison
Last year, SCHEV staff reviewed the formula for allocating need-based financial aid for Virginia students attending public undergraduate institutions. As a decentralized financial aid system, SCHEV makes recommendations for how to fund our institutions while the institutions set the award amount students receive.
As a result of our review, the General Assembly approved $60 million in state financial aid in the 2020-22 budget, representing a 14% annual increase statewide. (These funds were unallotted in April due to COVID-19.) Increases to individual institutions, however, ranged from less than 3% to nearly 24%. This post aims to explain the rationale for recommending that range in increases, and why providing across the board percentage increases would fall short of achieving Virginia's equity goals.
To reach our recommendations, we took a close look at Virginia students and their experiences with our financial aid system. What we found is that low-income students have higher financial need than middle- and high-income students, even after accounting for grants and scholarships. Research suggests these students will have to turn to loans to make up the difference, as low-income students are more likely to borrow and borrow more. Bottom line: Our system could do a better job supporting low-income students, and to do that we need to direct more funds to institutions that enroll higher concentrations of low-income students.
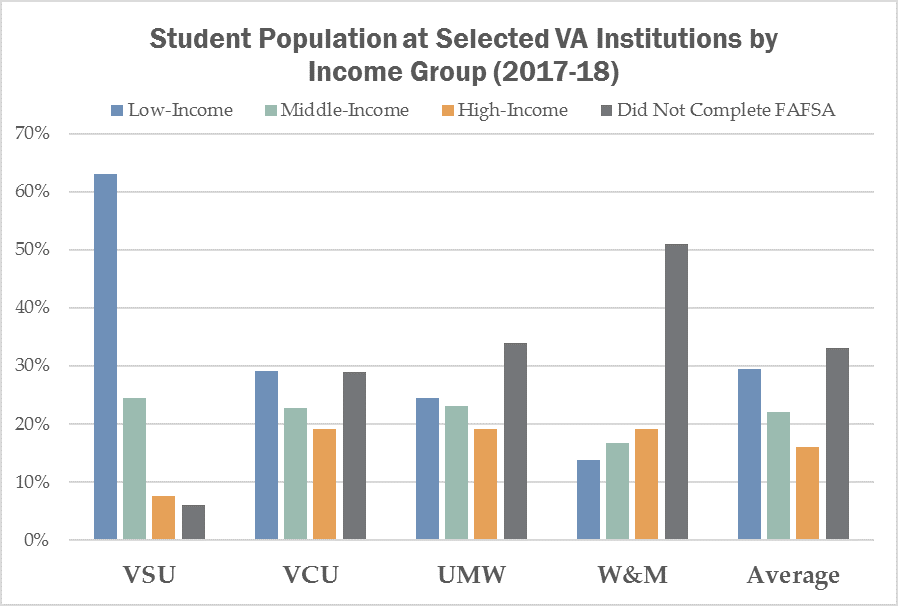
As a starting point, it is important to understand that the student bodies at Virginia's institutions vary significantly, particularly when it comes to their socio-economic background. In Virginia, we tend to organize students into three groups: low, middle and high-income. (See page 8 of the review for the exact definitions.) Only students who complete a Free Application for Federal Student Aid (FAFSA) are eligible for state financial aid, so SCHEV can only track the incomes of students who complete one. Higher-income students generally are less likely to complete a FAFSA, but we are unable to know the income of non-FAFSA filers for certain.
On one end of the spectrum, 63% of Virginia State University's (VSU) students were low-income in 2017-18. The vast majority (94%) completed the FAFSA. Students at Norfolk State University and UVA-Wise share similar profiles. On the other end of the spectrum, only 14% of the students at William & Mary come from low-income households, with more than half not completing a FAFSA. The University of Virginia, Virginia Tech and Christopher Newport University share similar profiles. This variation challenges lawmakers when weighing policy decisions with statewide implications; inevitably, impacts will vary by institution.

Looking at these income groups matters because there is a correlation between students’ income and whether or not they earn a degree. High-income students’ graduation rates are 20 points higher than low-income students. Other factors contribute to a student’s path through college, including academic preparation and the institution enrolled, but our research suggests that unmet financial need is a strong predictor of whether a student graduates.
Defining unmet need is relatively straightforward: you take the total cost of attendance, which includes tuition and fees, books, and room and board, and then subtract all grants and scholarships, as well as the student’s Expected Family Contribution, or EFC. The amount leftover is the student’s unmet need. Students may need to either cut expenses or find money elsewhere, for example, in the form of student loans or working additional hours. Or as the evidence below suggests, withdraw from school all together.
For every $2,000 in average unmet need, graduation rates decline three percentage points. Our review also shows an even stronger impact on students of color; meeting all students’ financial need corresponds with a 9% increase in graduation rates. So meeting students’ financial need is not only a completion strategy, but also an equity strategy. That is important because The Virginia Plan for Higher Education sets a goal of 70% higher ed attainment statewide by 2030, so understanding which groups graduate and which do not is key to reaching that goal.
So how does our state financial aid funding help low-income students? Our analysis showed that low-income students receive the majority of state financial aid funds, which in part contributes to lower net prices for these students. So far so good. But after accounting for gift aid (grants and scholarships) and EFC, low-income students still face slightly higher unmet need than middle-income students.

The fact that low-income students still have higher unmet need than middle-income students shows why it is so important to invest in financial aid. Need-based state financial aid is the best method at the state’s disposal to lower the unmet need for low-income students, which as noted above increases a student’s probability of graduating. While broad-based investments, such as tuition moderation, help all students, including high-income students, who already graduate at higher than average levels, investments in financial aid are critical to lowering unmet need for low- and middle-come students to reach our 70% attainment goal.
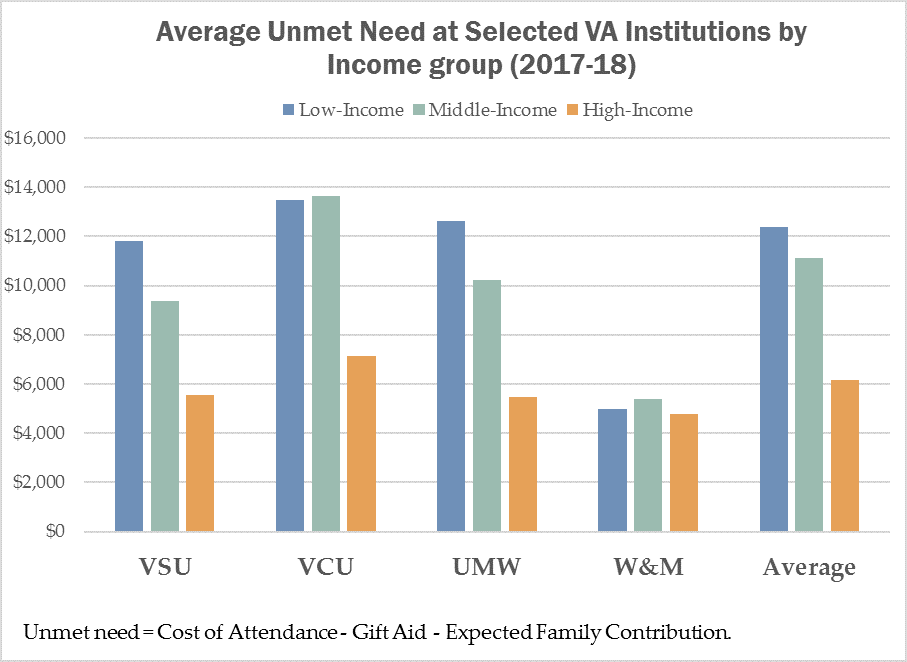
As usual, there is variation in unmet need by institution. Let’s take a look at the average unmet need by income group at the same institutions in the graph above.

For most of the institutions, students from higher-income families have significantly lower unmet need, just as is the case statewide. But, the average unmet need at William & Mary, an institution with fewer low-income students, is relatively low for all of their students. That’s great, and is partly due to commitments William & Mary has made with its own institutional funds. Institutions like Virginia Commonwealth University (VCU) and University of Mary Washington (UMW) do not have those institutional resources to make that same commitment, and this could be contributing to higher average unmet need for their students.
The Takeaway
Financial aid is complicated, and there is never one reason or metric to explain what’s happening. From SCHEV’s perspective, we know that there is a strong relationship between unmet need and earning a degree. Recall that for every $2,000 in unmet need (what is being measured on the y-axis above), graduation rates decline three percentage points. That’s why we changed the funding formula from focusing on the aggregate unmet need at each institution to focusing on those with the higher average unmet need. This strategy targets those institutions enrolling larger numbers of low-income students, supports increased investments in financial aid and assists in meeting the Commonwealth’s completion goals.
Even though the General Assembly adopted SCHEV’s funding recommendations, Governor Northam was forced to freeze it in April. (See previous Insights’ post, Unallotted.) In October, the Council recommended those financial aid investments be reinstated, and the General Assembly will have an opportunity to restore those investments in January.
Welcome to Insights, SCHEV's platform to interpret and communicate data and policy with the overall goal of informing policy-making, engaging institutions and drawing attention to these resources. Centered around SCHEV's nationally leading data collection, each Insight will visualize complex ideas and help inform funding and policy decisions.
