By Tom Allison & Claire Mairead
Last year, a pair of reports by Education Reform Now asserted that many of Virginia’s colleges and universities underserve low-income students and Pell Grant recipients, leading to “de facto economic segregation” in higher education. These reports were widely covered in the media and have led to renewed attention on racial and class disparities at institutions of higher education.
Pathways to Opportunity, Virginia’s statewide strategic plan for higher education, aims to make higher education equitable, affordable and transformative. Metrics include closing gaps in borrowing, median earnings and attainment among students from economically disadvantaged backgrounds. This Insight takes a deeper look at how Virginia’s public institutions of higher education are serving low-income students in the Commonwealth.
Enrollment
One way to measure how low-income students access institutions is through the number of students receiving Pell Grants, the federal grant awarded to students who display “exceptional financial need.” The Pell Grant is the largest federal need-based grant, awarded on a sliding scale based on students’ and families’ financial strength.
In January 2022, SCHEV presented national data of students receiving Pell grants to the Senate Finance and Appropriations Committee. As a jumping off point, we compared statewide Pell enrollment rates (the percent of all undergraduate students who receive a Pell Grant) to see where Virginia ranked among other states. Nationwide, 33% of undergraduate students attending four-year public institutions receive a Pell Grant. Virginia’s rate, 26%, is significantly smaller, ranking Virginia 41st in the nation for its rate of Pell recipients. However, as eligibility is determined by a students’ financial capability, it is worth noting that Virginia’s poverty rate is ranked 42nd, which is aligned with our Pell rate.
Those rates include all students, regardless of residency, but state policy and budgets tend to focus on in-state students. And like most aspects of higher education in Virginia, considerable variation exists at the institutional level. SCHEV’s research site allows users to explore that variation. As a whole, in-state Pell enrollments at public four year colleges have risen slightly since 2015, while Pell enrollments at public two-year colleges and private non-profit institutions have decreased.

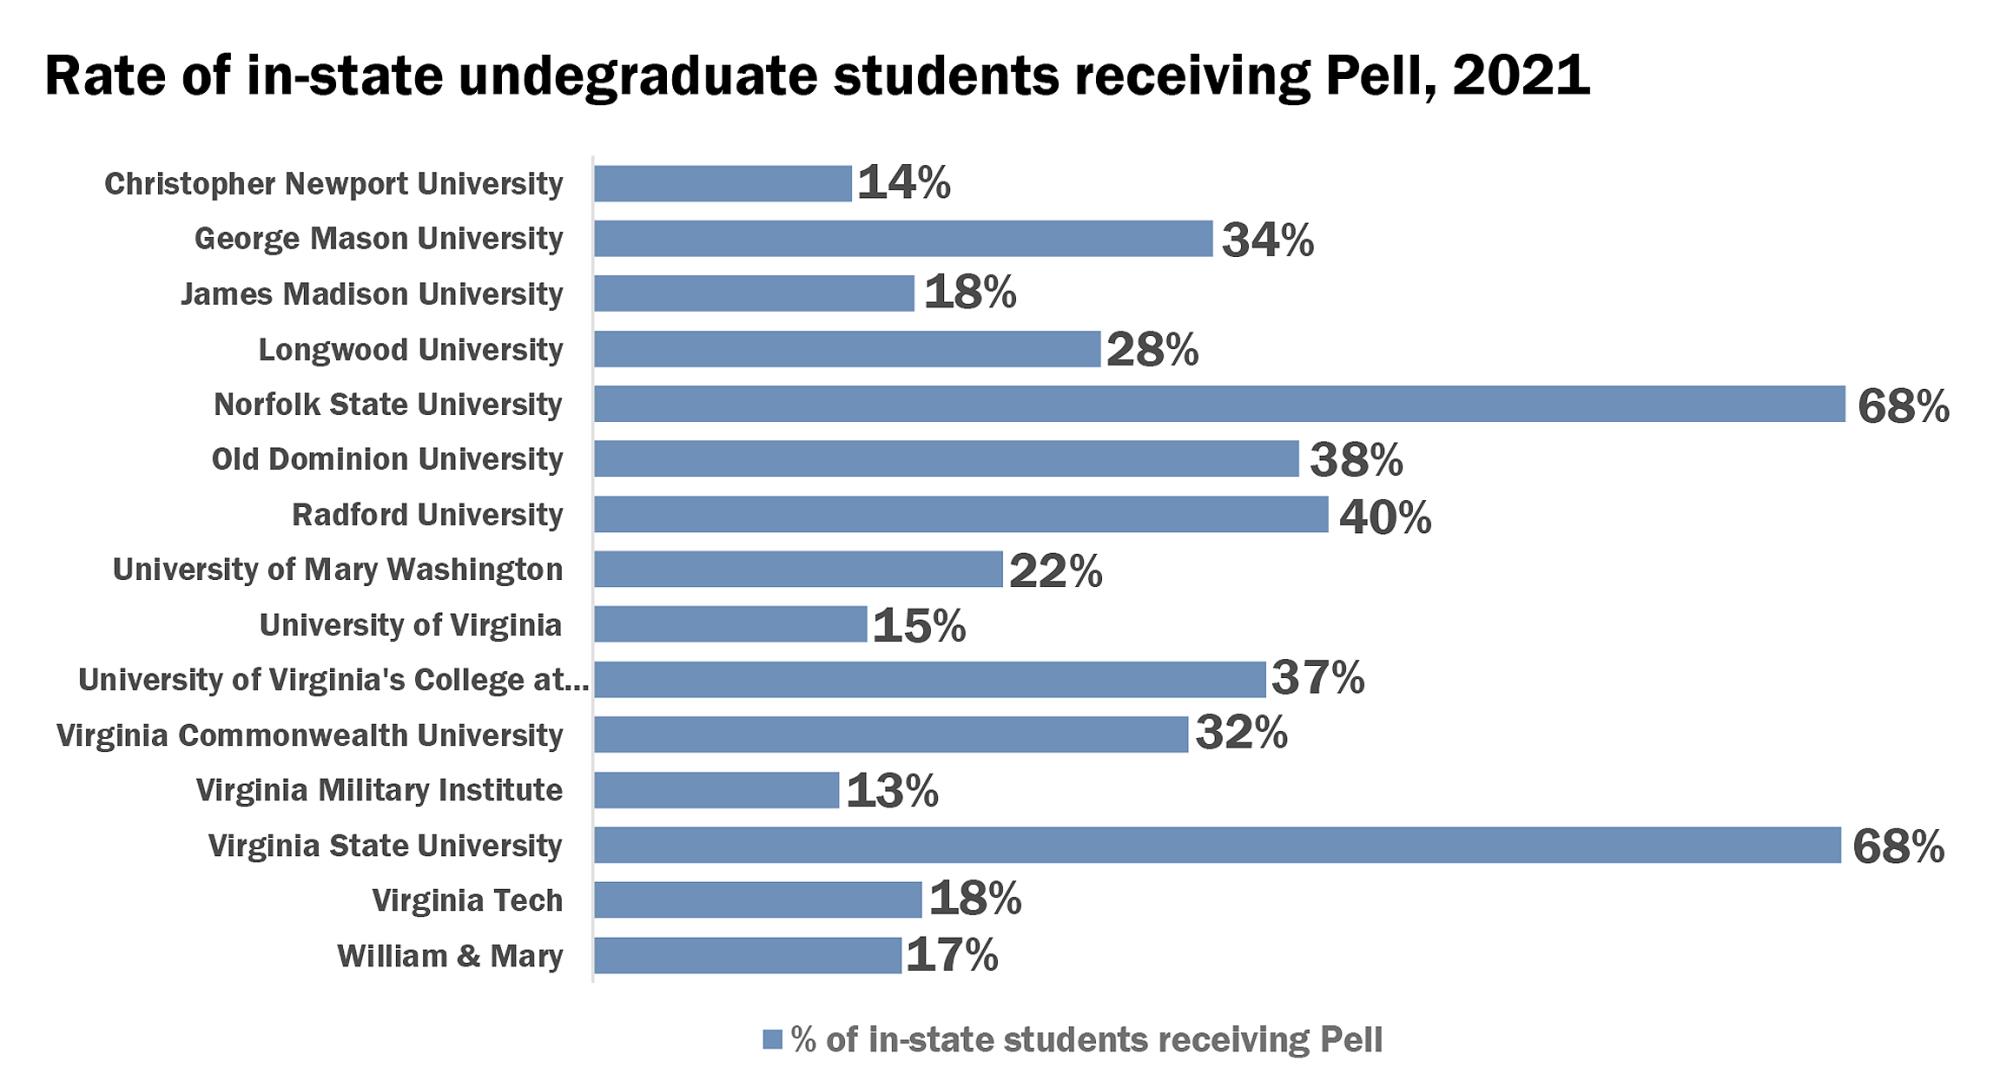
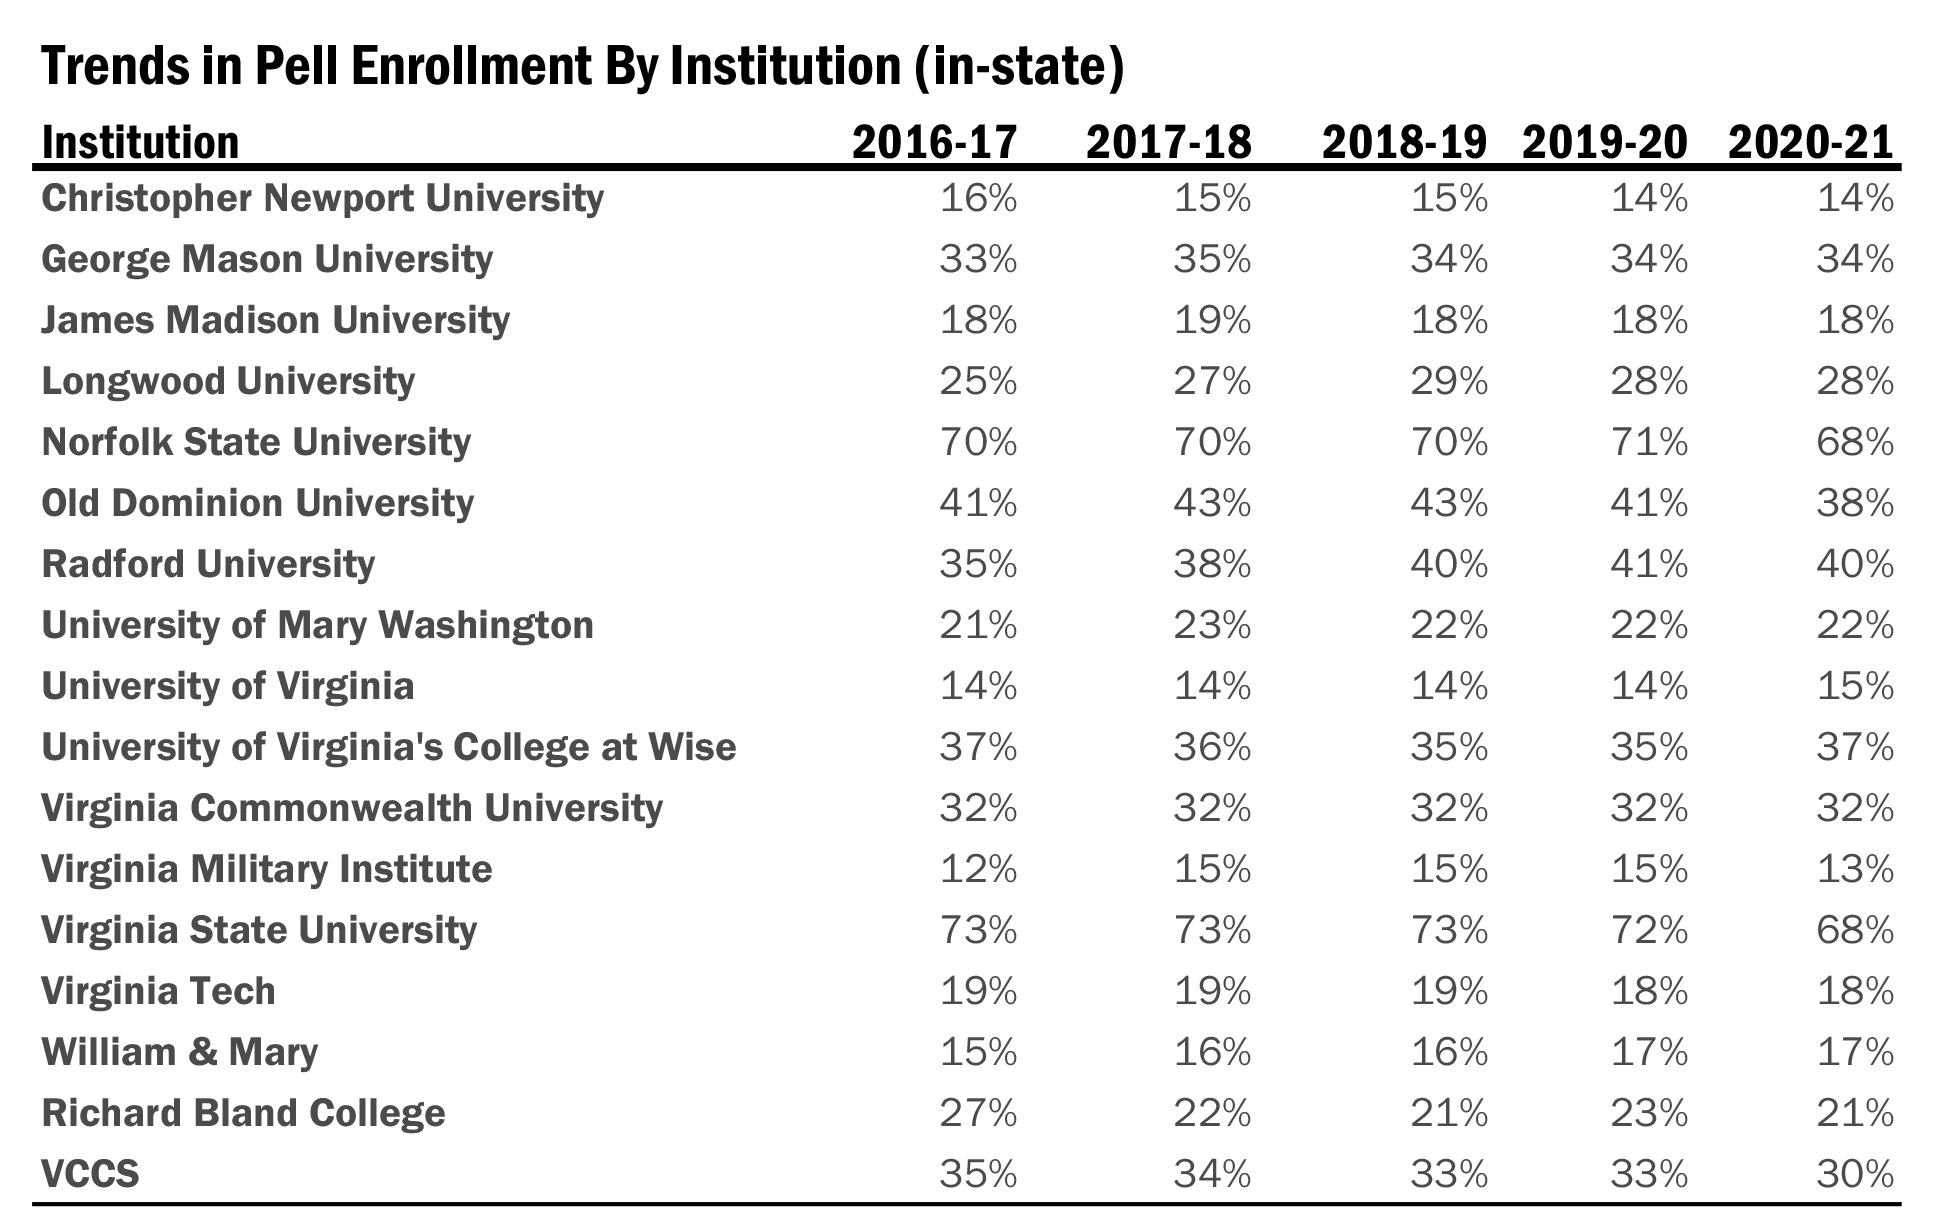
Across Virginia’s four-year public institutions, the rate of in-state Pell recipients enrolled ranges from 13% to 68%. Among the institutions with low Pell enrollment, trends have varied between schools. Over the past five years, William & Mary and VMI increased their Pell enrollment rates by two percentage points, while Christopher Newport’s decreased two percentage points. Virginia Tech and James Madison University have remained relatively stable in their in-state Pell enrollments.

Source: https://research.schev.edu/fair/pell_dom_report.asp
Unmet Need and Graduation Rates
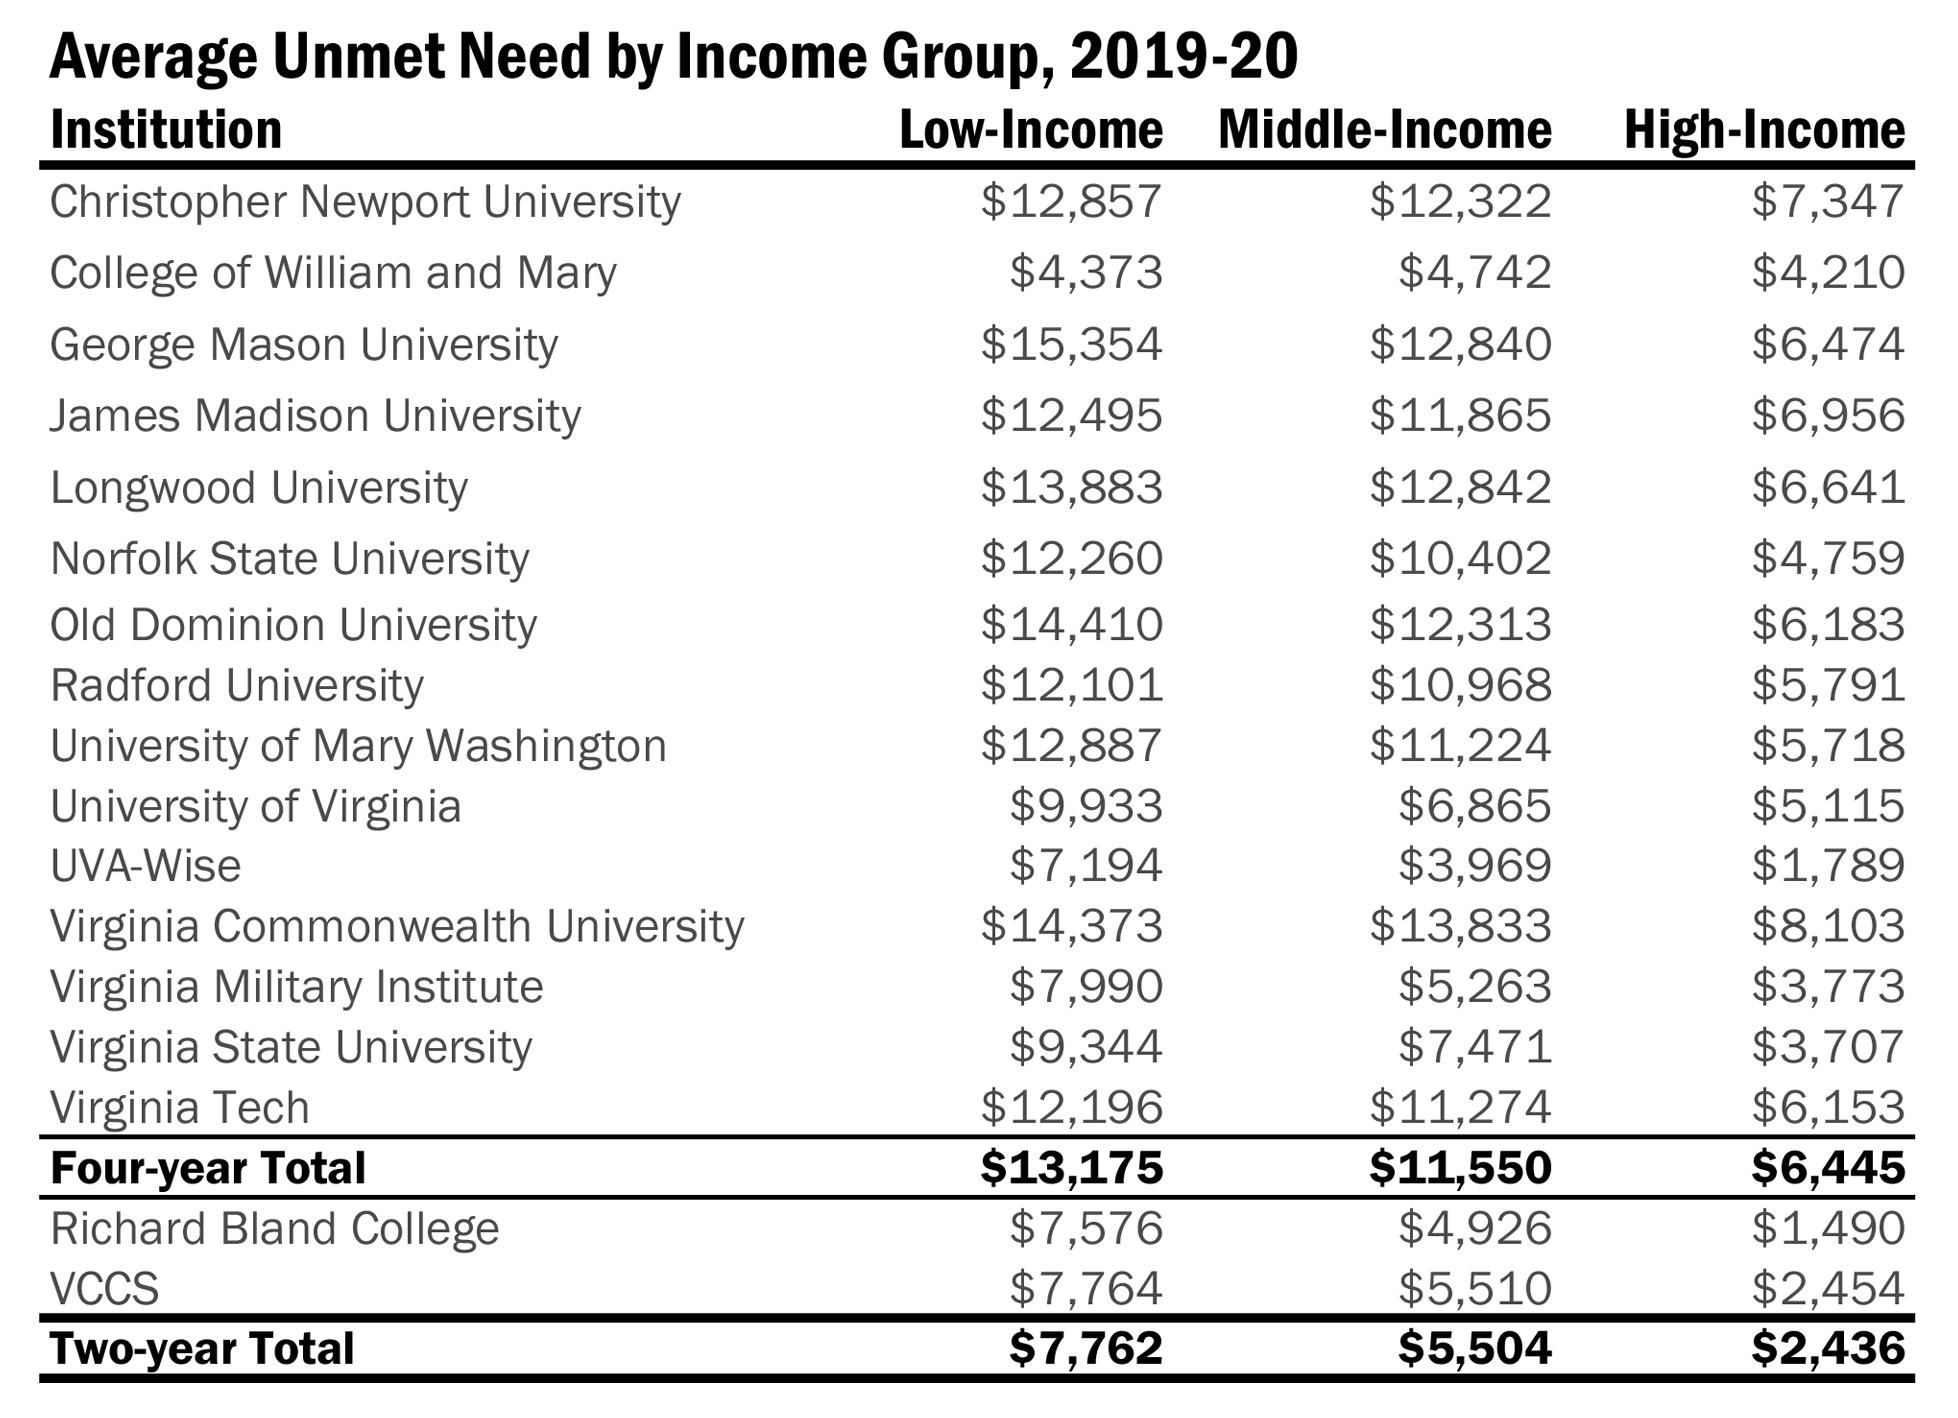
Pell is just one component of affordability, as students face varying costs depending on their institution and use various packages of federal, state, institutional and local and private aid to help pay for college. The dollar figure remaining after accounting for all “gift aid” and the student’s contribution is considered the student’s “unmet need.” Despite grants and scholarships, low-income students have, on average, higher unmet need than middle and high-income students.

Source: Financial Aid at Public Institutions of Higher Education Report
The average unmet need for low-income students is $13,175 at Virginia’s public four-year institutions and $7,762 at public two-year institutions. In contrast, middle-income students have about $2,000 less unmet need on average, both at two- and four-year colleges. High-income students have a significantly lower average unmet need. Low-income students have higher average unmet need than middle- and high- income students at every institution except William & Mary. Unmet need for low-income students ranges from approximately $4,000 at William & Mary to more than $15,000 at George Mason.
This matters because financial aid and reduced unmet need is associated with increased graduation rates. Research at the national level, as well as in other states and in Virginia are consistent on this point. Funding financial aid based on unmet need is a strategy to improve student success. SCHEV redesigned the financial aid funding formula based on student unmet need.
The Takeaway
Institutions and the state both have their part to play in achieving affordability goals. Institutions should ensure that they are serving low-income students by prioritizing affordability and providing support through scholarships, student services, K-12 outreach programs and efforts to recruit students from diverse economic backgrounds. The state can provide support through outreach, need-based aid investments and policy changes such as updated funding for institutions. In the 2022 session, the General Assembly created a competitive grant program, funded at $25 million in FY 2024, to enhance efforts to recruit and retain students eligible for the Pell Grant. Institutions must demonstrate efforts to restructure outreach, recruitment, admission and retention procedures and funds may be used to support initiatives to attract, enroll, and retain low-income students. As directed by the budget language, SCHEV will partner with a nationally recognized consultant with experience in this area to develop the program.
In order to address the declining purchasing power of state aid and reduce unmet need, SCHEV recommended a large increase in financial aid for the coming biennium. The state funded an additional $160 million in financial aid by FY 2024, distributed to institutions whose students have the highest unmet need. SCHEV estimated that our recommended increase would add, on average, more than $950 per student statewide, and between $1,500 and $2,000 per student at the six institutions demonstrating the highest levels of need (George Mason, Radford, Old Dominion, Norfolk State, UVA-Wise and Virginia State).
We also published a study of cost and funding needs for Virginia public higher education institutions. The study recommends new methods for allocating state funds to colleges and universities in ways that align with the state goals of an affordable, equitable and transformative education. While college affordability is a persistent problem, these new investments give us reason to be optimistic for the future.
Welcome to Insights, SCHEV's platform to interpret and communicate data and policy with the overall goal of informing policy-making, engaging institutions and drawing attention to these resources. Centered around SCHEV's nationally leading data collection, each Insight will visualize complex ideas and help inform funding and policy decisions.
