By Tom Allison
To provide a first look at how the fall semester is shaping up, SCHEV is releasing early enrollment estimates of the public and private nonprofit institutions that report data to us. These estimates are still preliminary and will change before final reports arrive later in the year, but at this time represent the most comprehensive look at college enrollments for fall 2022.
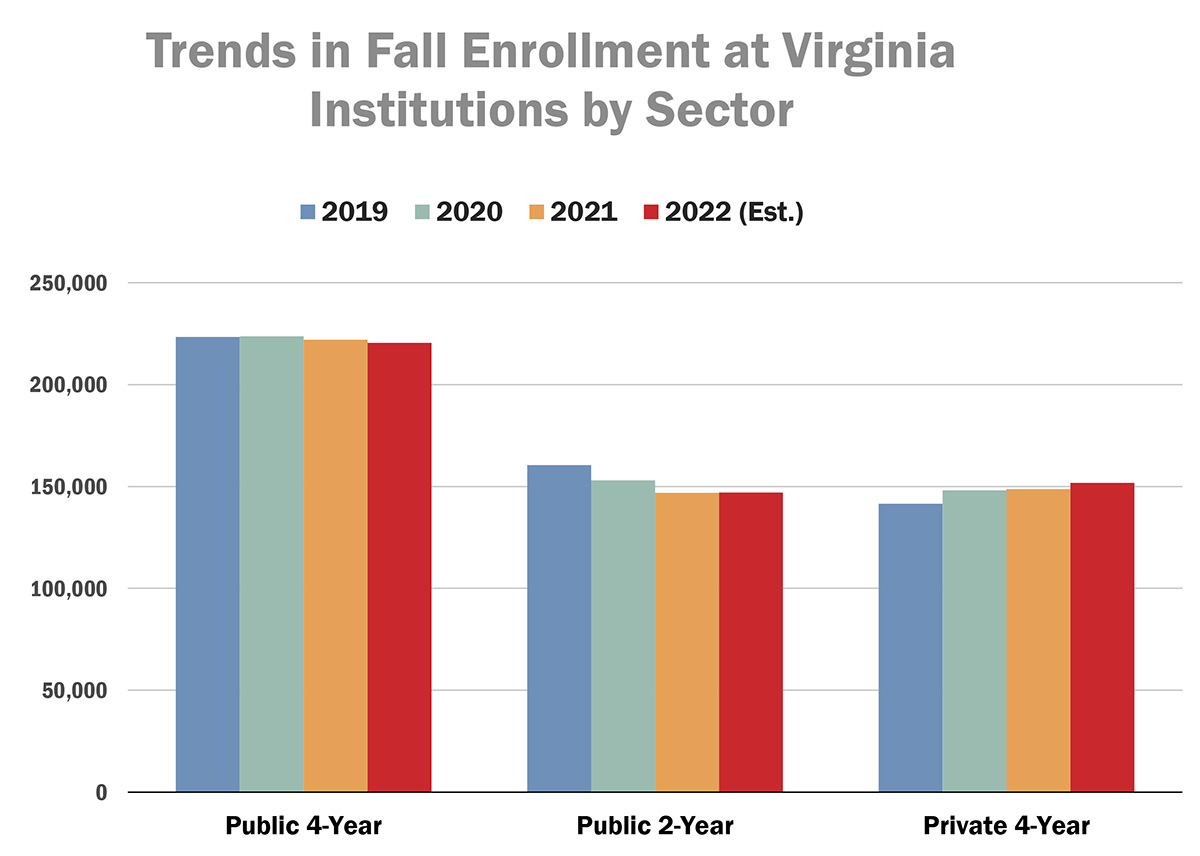
Fall enrollments at Virginia's colleges held relatively steady in 2022 compared to last year. Students enrolled in four-year public institutions declined 0.7%. The two-year public institutions were basically flat, and the private non-profits increased by 2.1%.

Source: https://research.schev.edu/enrollment/EEE_Report.asphttps://research.schev.edu/enrollment/E2_Report.asp
https://research.schev.edu/enrollment/E2_Report.asp
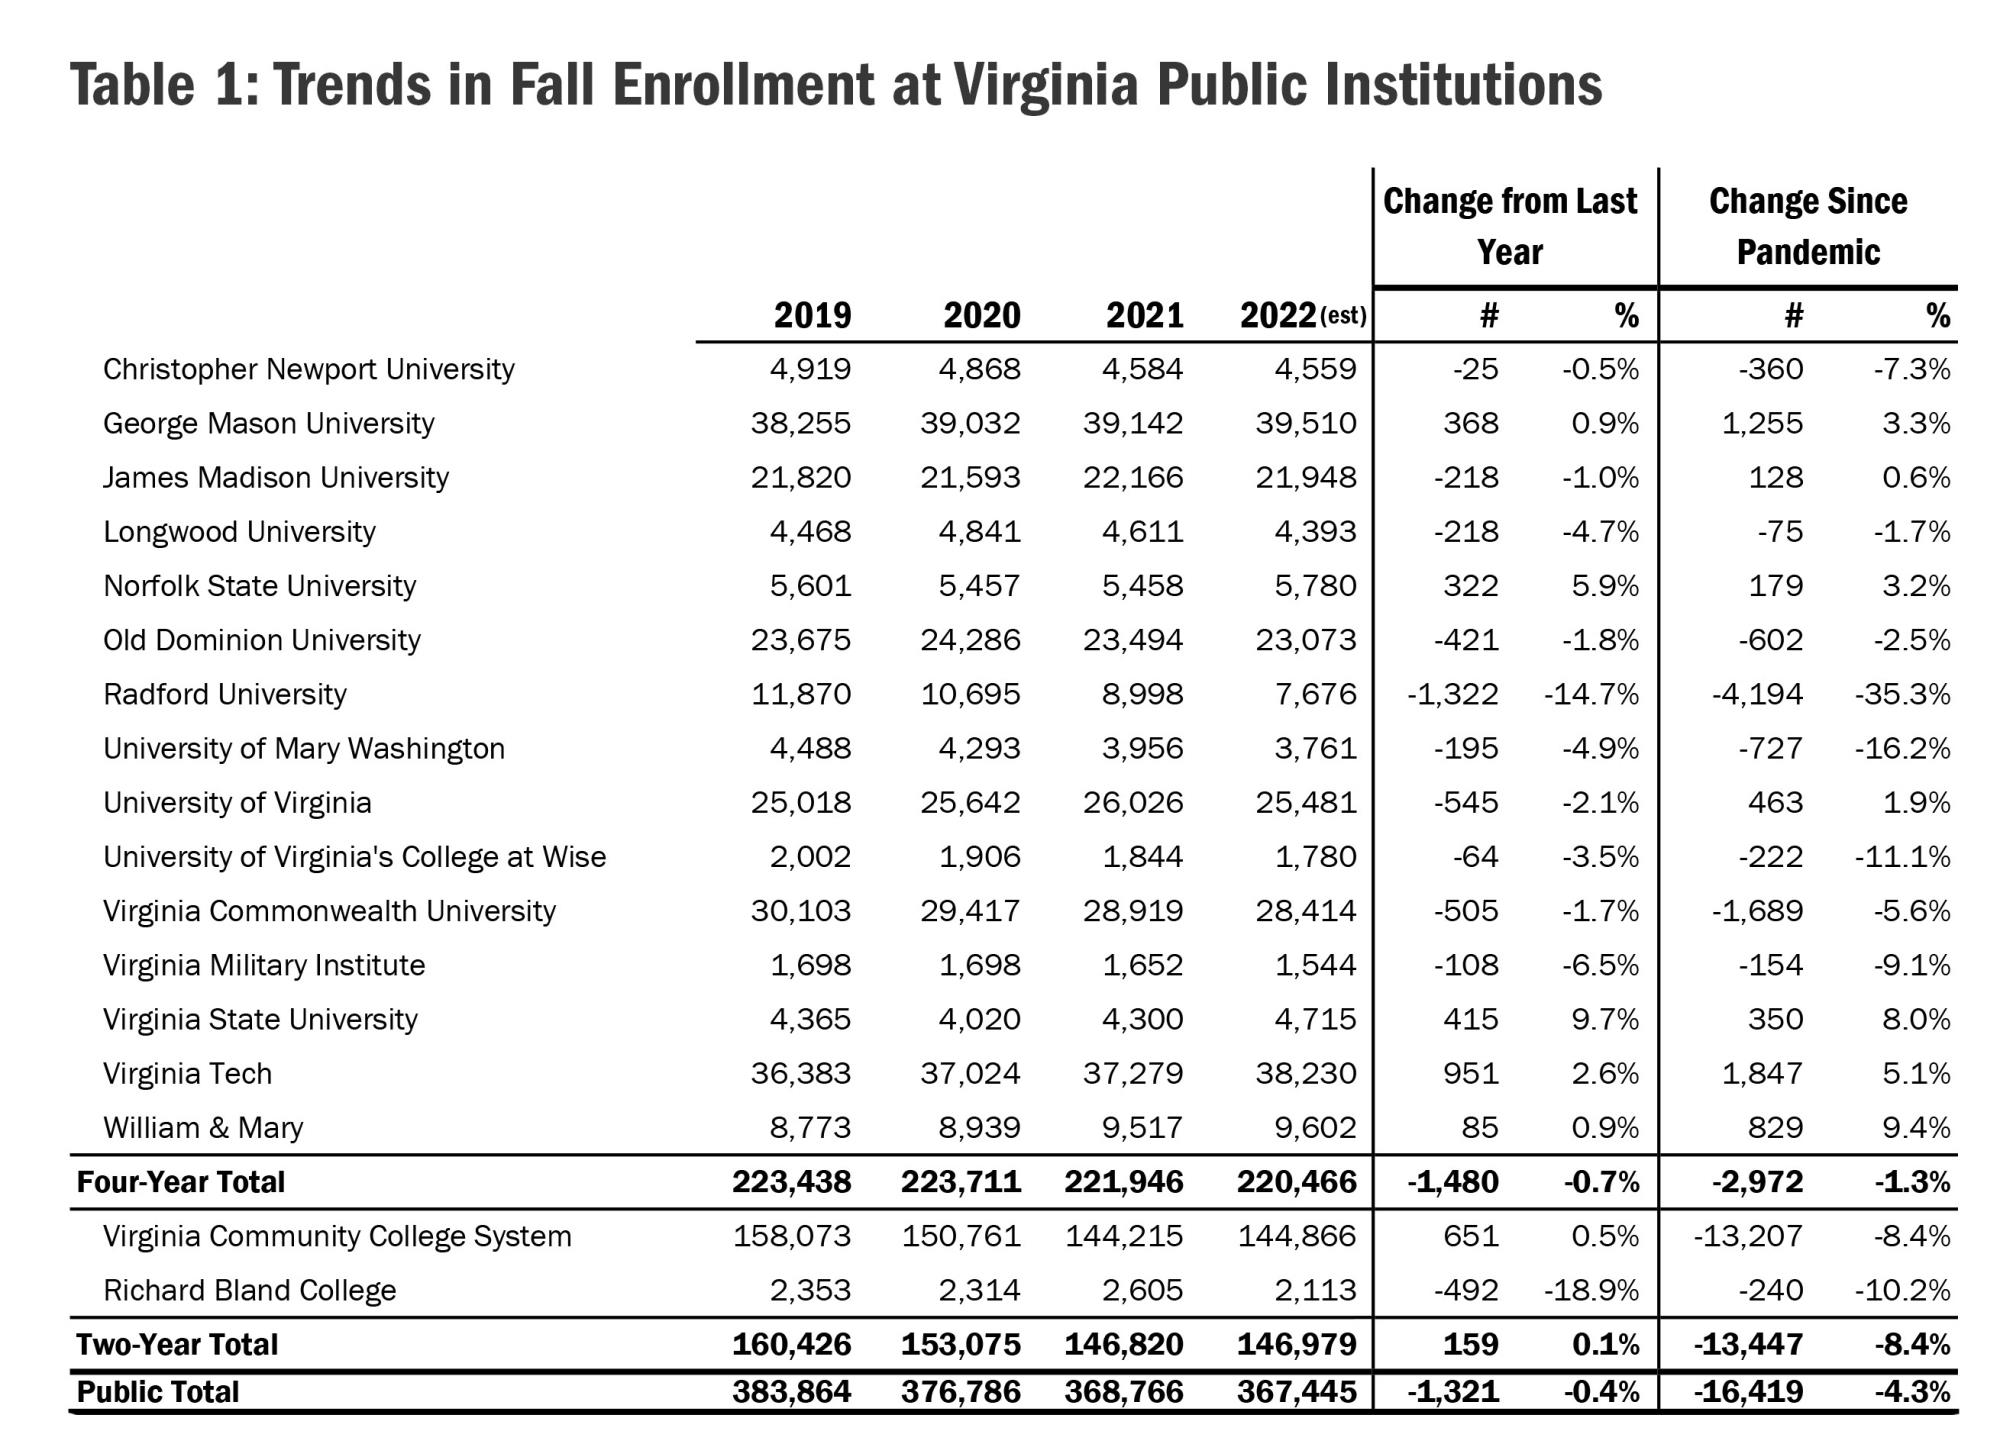
Looking further back to pre-pandemic levels in 2019, enrollment at the four-year publics declined by 1.3%. The two-year publics declined 8.4% in that three-year period, and the private non-profits increased by 7.3%.
Virginia has avoided the steeper enrollment declines seen at the national level. While national estimates are not available for fall 2022, national enrollments declined 3% at public four-years, 2% at private for-profits, and 13% at public two-year institutions between 2019 and 2021.
As is usually the case in Virginia higher education, enrollment levels have varied by institution. Radford University lost 35% of its enrollment since 2019, partly due to a competency-based education contract that expired in 2020. Also seeing declines since the pandemic are University of Mary Washington (-16.2%), Richard Bland College (-10.2%), UVA-Wise (-11.1%), Virginia Military Institute (-9.1%) Christopher Newport University (-7.3%), Virginia Commonwealth University (-5.6%) Old Dominion University (-2.5%) and Longwood (-1.7%). Enrollment at the Virginia Community College System declined 8.4% since the pandemic.

Source: https://research.schev.edu/enrollment/EEE_Report.asp
https://research.schev.edu/enrollment/E2_Report.asp
Perhaps most noteworthy is the growth at the Historically Black Colleges and Universities. Virginia State University grew 8% since 2019 and Norfolk State grew 3.2%. Both institutions saw steep declines in the first year of the pandemic. Other institutions that grew include William & Mary (9.4%), Virginia Tech (5.1%), George Mason University (3.3%), University of Virginia (1.9%), and James Madison (0.6%).
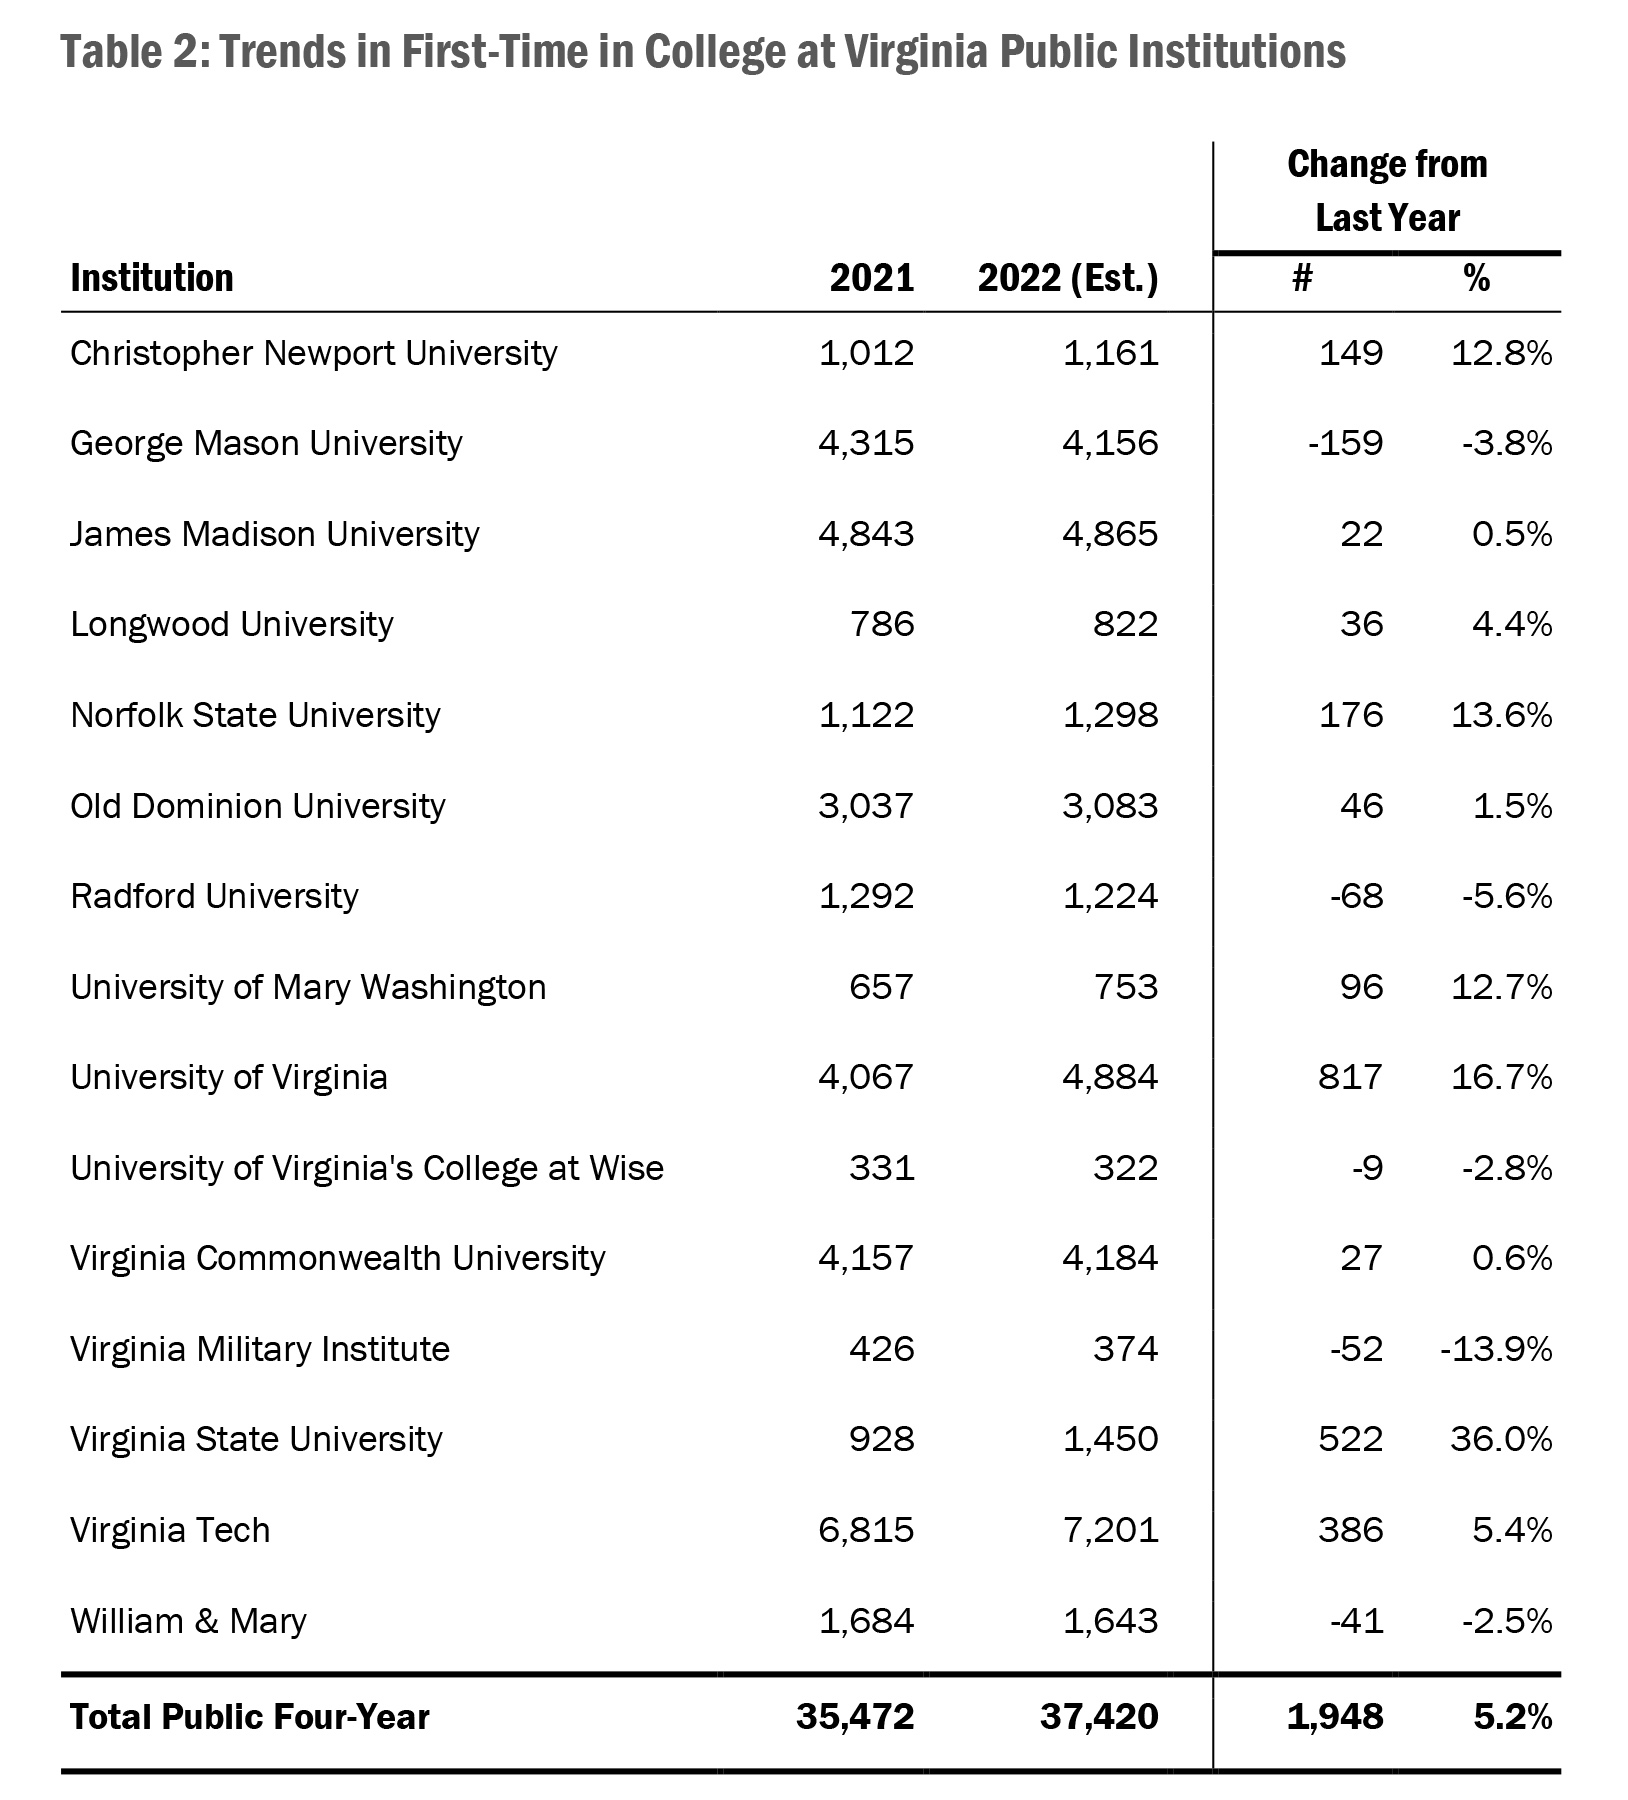
While there are many ways to disaggregate these enrollment trends, one important dimension is “first-time in college,” students just beginning the postsecondary career. This is important because it can project future enrollment levels. If the number of first-time in college (FTIC) students increases, then many of those students will count toward larger total enrollments in the future. The number of FTIC students grew by nearly 2,000 students between 2021 and 2022, a 5.2% increase. This is the case for 10 public four-year institutions.

Source: https://research.schev.edu/enrollment/EEE_Report.asp
https://research.schev.edu/enrollment/E2_Report.asp
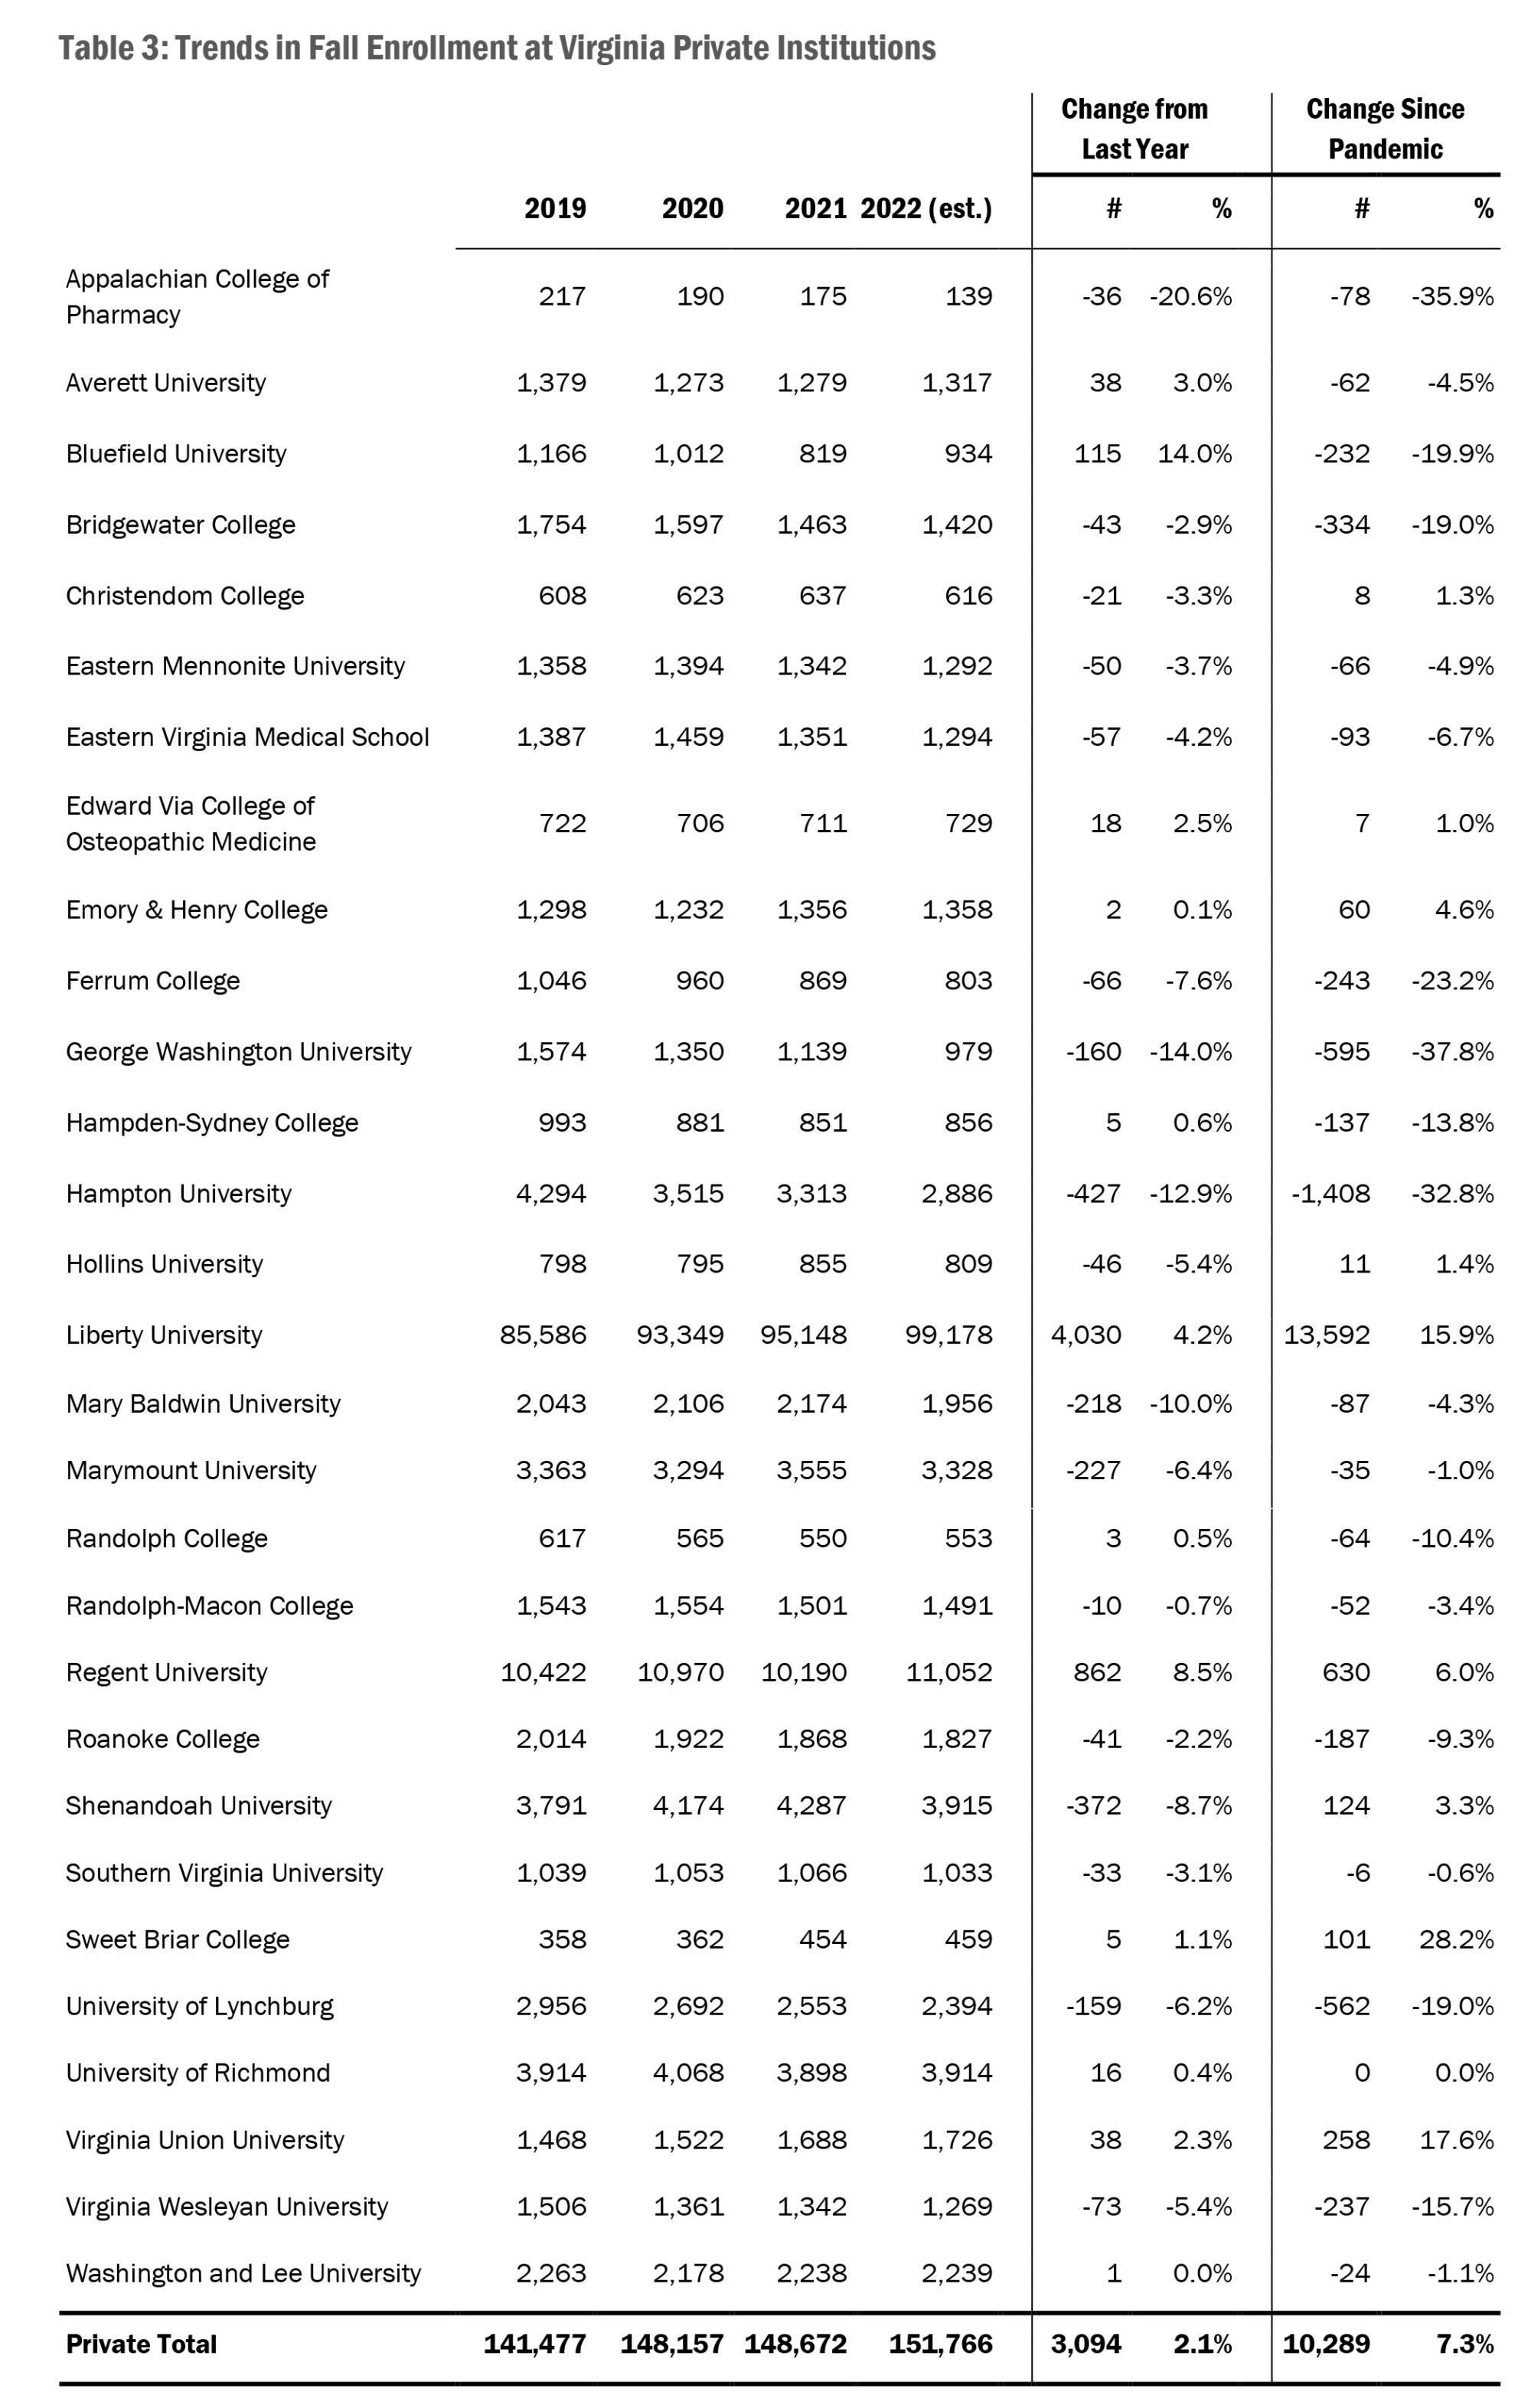
Liberty University, whose students make up 65% of the private four-year institutions that submit data to SCHEV, grew by 4,030 students or 4.2%. The next largest institution, Regent University, added 862 students, or 8.5%. Over 80% of students at both institutions live off-campus.

Source: https://research.schev.edu/enrollment/EEE_Report.asp
https://research.schev.edu/enrollment/E2_Report.asp
Analyzing the enrollment levels by those dimensions might show other trends. As always, we invite readers to make their own tables at SCHEV’s research website. Users also can compare previous year’s early enrollment estimates with the actual enrollments here. Last year, private institutions and public two-year institutions over-estimated their enrollments, while public four-year institutions under-estimated.
The Takeaway
There are numerous factors that might explain why some enrollments are going up and some are going down. The pandemic disrupted many aspects of our lives and instilled enough certainty that might have influenced some students to “hit pause” on starting any new academic plans. SCHEV staff recently presented a more in-depth analysis of enrollment trends at the September Council meeting, which concluded enrollments in higher education have been declining since 2010, but were similar to national trends. The baseline of 2010 is important, as the economy was still recovering from the Great Recession. In July 2022, the unemployment rate was 2.7%, a historic low. When jobs are plentiful, potential students may choose the workforce over postsecondary education. The recession also was partially responsible for a decline in births, which will cause a 6% decline in high school graduates by 2026.
Educational attainment comes with economic and social benefits, however. College graduates earn higher wages, are more likely to have health insurance, pay taxes, vote and volunteer, and are less likely to rely on public assistance.
There are initiatives currently underway that might increase enrollment in the future:
The Governor and General Assembly funded a new statewide college access program, Guidance to Postsecondary Success (GPS), housed at SCHEV. This program develops resources and strategies to improve FAFSA completion rates and generally help prospective students navigate the college application process. It also funds the first shared position between the Department of Education and SCHEV.
Virginia also was recently awarded a GEAR UP Virginia (Gaining Early Awareness and Readiness for Undergraduate Programs) grant: a seven-year, $24.7 million federal college-access grant targeting over 8,000 students in Virginia’s highest-need middle and high schools.
Institutions are continually reviewing and enhancing their outreach strategies. Examples include the Virginia College Advising Corps at the University of Virginia and the Community Captains program at Christopher Newport University, and many others.
The Governor and General Assembly recently created a competitive grant program, funded at $25 million in FY 2024, to enhance efforts to recruit and retain students eligible for the Pell Grant. Institutions must demonstrate efforts to restructure outreach, recruitment, admission and retention procedures, and funds may be used to support initiatives to attract, enroll and retain low-income students. Considering low-income students consistently enroll in postsecondary programs at lower rates than other income groups, this initiative could be promising.
Notes on Methodology
The SCHEV Early Enrollment Estimates (EEE) ask institutions to capture enrollment counts earlier in the year than the fall headcount collection; these counts become the official enrollment record for the fall semester. The primary challenge is that these reports are due to SCHEV on a specific day, and the actual semester start dates at the institutions vary by two to three weeks. This matters because the first two or three weeks of a semester are very much in flux as students are able to add or drop classes without penalty. Thus, for many of the institutions, the due date to SCHEV comes during this period of changing enrollment and can only provide preliminary estimates.
An additional consideration is that the community colleges have short terms within the semester, and for those courses that take place in the last half of the semester, some enrollments have not yet been made. Since VCCS enrollment is reported to SCHEV as end-of-term data, the EEE generally shows a lower enrollment than what is reported at the end of the semester.
Welcome to Insights, SCHEV's platform to interpret and communicate data and policy with the overall goal of informing policy-making, engaging institutions and drawing attention to these resources. Centered around SCHEV's nationally leading data collection, each Insight will visualize complex ideas and help inform funding and policy decisions.
